TrustRadius
Percona Monitoring and Management (PMM)

Percona Monitoring and Management (PMM)

Overview

What is Percona Monitoring and Management (PMM)?

Percona Monitoring and Management (PMM) is a highly sophisticated open-source solution that helps businesses manage their database environments effectively. It simplifies the overall management process, reduces complexity and optimizes performance by quickly identifying issues that may impact business...

Read more
Recent Reviews

TrustRadius Insights

In-Depth Metrics: Many users have praised the tool for providing in-depth metrics for MySQL, DBaaS, and ProxySQL. They appreciate being …
Continue reading

PMM MySQL Observability champion

10 out of 10
October 06, 2020
We are using PMM across the whole organization. It's addressing the problem of observability. We have improved our MTTD and Capacity …
Continue reading
Read all reviews
Return to navigation

Pricing

View all pricing
N/A
Unavailable

What is Percona Monitoring and Management (PMM)?

Percona Monitoring and Management (PMM) is a free, open-source database monitoring and management solution. It helps enterprises reduce complexity and simplify management, while optimizing performance and improving the security of business-critical database environments - on-premises or in the…

Entry-level set up fee?

  • No setup fee
For the latest information on pricing, visithttps://pmmdemo.percona.com

Offerings

  • Free Trial
  • Free/Freemium Version
  • Premium Consulting/Integration Services

Would you like us to let the vendor know that you want pricing?

11 people also want pricing

Alternatives Pricing

N/A
Unavailable
What is LogicMonitor?

LogicMonitor provides an agentless SaaS-based monitoring platform. LogicMonitor provides prebuilt integrations and an open API, and is designed to provide monitoring across networks, servers, applications, websites, and containers, including insights and reporting capabilities.

What is dbForge Studio (Edge)?

dbForge Studio is provided by Devart and is a universal front-end client for database management, administration and development. Devart's GUI tool provides utilities to compare, synchronize, and back up databases (e.g. MySQL, Oracle, SQL Server, PostgreSQL, etc.) with scheduling, and includes the…

Return to navigation

Product Demos

Installing Percona Monitoring & Management PMM on Ubuntu 20.04 LTS - Database Monitoring Tutorial

YouTube

Percona Monitoring and Management PMM Demo 35 - Platform Teams - 2022-05-31

YouTube

#PMM Overview | about Percona Monitoring and Management

YouTube

Percona Monitoring and Management Demo

YouTube

Percona Monitoring and Management Demonstration

YouTube
Return to navigation

Product Details

What is Percona Monitoring and Management (PMM)?

Percona Monitoring and Management (PMM) is a highly sophisticated open-source solution that helps businesses manage their database environments effectively. It simplifies the overall management process, reduces complexity and optimizes performance by quickly identifying issues that may impact business operations. PMM has innovative tools which improve data security, reduce the risk of exposure and prevent potential outages in your database systems.

This software's primary objective is to provide users with a single platform to efficiently monitor databases' health status, including troubleshooting bottlenecks and scaling issues without vendor lock-in or exorbitant fees. It seamlessly integrates both on-premises and cloud-based databases into one centralized location for easy access. Thousands of companies worldwide trust PMM to ensure that their complex database environments are functioning smoothly while maintaining high levels of security standards. Percona's team provides customers with enterprise-class software, support, consulting services along with training options from seasoned professionals who operate globally in more than 35 countries worldwide.

Percona Monitoring and Management (PMM) Features

  • Supported: Alerts and notifications
  • Supported: Dashboard
  • Supported: Query Analysis
  • Supported: Anomaly Detection
  • Supported: Troubleshooting
  • Supported: Resource Optimization
  • Supported: Performance Monitoring
  • Supported: Historical Trend Analysis
  • Supported: Dependency Tracking
  • Supported: Access Controls/Permissions
  • Supported: Prioritization

Percona Monitoring and Management (PMM) Screenshots

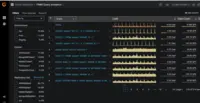
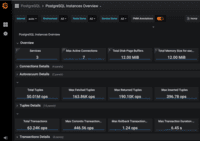
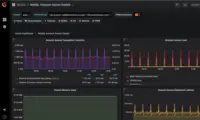
Screenshot of PMM Home DashboardScreenshot of PMM Query AnalyticsScreenshot of PMM PostgreSQLScreenshot of PMM MySQL Amazon Aurora Details

Percona Monitoring and Management (PMM) Video

Percona Monitoring and Management 2 - Improved Query Analytics

Percona Monitoring and Management (PMM) Technical Details

Deployment TypesOn-premise
Operating SystemsWindows, Linux, Mac
Mobile ApplicationNo

Percona Monitoring and Management (PMM) Downloadables

Return to navigation

Comparisons

View all alternatives
Return to navigation

Reviews and Ratings

(13)

Attribute Ratings

Reviews

(1-5 of 5)
Companies can't remove reviews or game the system. Here's why
Score 9 out of 10
Vetted Review
Verified User
We use PMM in both our development and IT teams to monitor our database. The tool allows us to trace performance and discover optimisation opportunities, which provides significant cost savings over upgrading the platform as we grow our business. Before we integrated PMM we were reliant on standard tools to manually investigate production state, variables and other metrics.
  • Visibility of performance between cluster nodes.
  • Presents less obvious metrics.
  • Very customisable.
  • Documentation sufficient but not outstanding.
  • Almost 'too much' data presented.
  • Perhaps could have alert defaults.
Databases work great when fresh and clean but over the years you seem to encounter more and more performance issues. Over-enthusiastic developers brimming with confidence can quickly overload tables with indexes or make changes without thinking about scenarios outside their ticket. Business growth can lead to server strain if you aren't monitoring your infra vigilantly. Queries that once worked well can suffer over time and you need a good tool to dig in to the data. PMM is excellent for these kinds of use-cases.

I initially found the vast quantity of data presented to be overwhelming, but that is where I needed to raise my knowledge to understand the DB internals better. If you feel you don't know enough about your database performance the dashboards will keep you busy for a while. The Query Analytics tool may also be insightful. My only gripe is I wish there was more documentation on explaining some of the data for less experienced MySQL users.


  • Smart reporting (with context) of key DB metrics.
  • Query analytics.
  • Graphed timeseries of all data.
  • Neat breakdown of DB activity by user.
  • Instrumental in identifying $BAD_USERS.
  • Helped prove DB not at fault for App issue.
  • Has helped us tweak conf.
I haven't found a tool anything like PMM in terms of detail, delivery, and price.
The data presented is pretty easy to view and examine. I have had no issues exploring data over time, filtering down to specifics, or managing users. The one area I feel could be improved is dashboard names/menu navigation. The menu feels like a limitation of the Grafana framework, and the dashboard names seem just a bit similar so you may head in the wrong direction initially.
  • Changing your time range to match your issue/incident
  • Completing tool updates within the tool
  • Filtering to your specific database/user
  • Troubleshooting agent integration issues
Delphine Jakab | TrustRadius Reviewer
Score 8 out of 10
Vetted Review
Verified User
Incentivized
The most prominent thing is that [Percona Monitoring and Management (PMM)] has greatly reduced much of the complexities by simplifying management. It has made deployment very easy for us. It keeps on adding new features in order to bring ease for the users. There is the availability of many unique features that makes my work easier for me. I am having a very positive experience with this software because it is playing a great role in my department. In my opinion, this tool is enriched with maximum features for effective management of monitoring of MySQL.
  • It serves us in the best ways. It has given us a golden opportunity to deeply looking at time-based analysis in order to make sure whether the data system is working perfectly or not.
  • It can be set up straightforwardly without any hurdle. It always gives a smooth performance with much accuracy. It keeps on making innovations by adding new features as well as default dashboards for meeting all of our needs.
  • The most impressive thing about this tool is that it consists of a huge number of incomparable features such as the Live supporting feature, Alerting feature, tracking, communication dashboard, and many other beneficial features too.
  • Sometimes it creates problems while serving a huge number of servers but I am sure its efficient team will overcome this problem soon and with its rapid advancements there will surely be more latest and advanced alerting options.
  • Truly speaking this is a great invention with very few shortcomings. I never face any dependency issues.
I suggest you try [Percona Monitoring and Management (PMM)] at least once. Afterward, it will make you feel relaxed. It really works and gives you more than your expectations. It is equipped with multiple latest and advanced tools that will fully satisfy you. So obviously there will be no need to concern other devices. It is an excellent data management solution and also it is the best monitoring device than any other.
  • Query and cache details.
  • MySQL connections chart.
  • Customization of automation features.
  • Client thread estimator.
  • This is a matchless tool for keeping us alert with all amazing monitoring capabilities. Almost all of its features and functionalities help us in achieving our goals by enhancing success rates.
  • Customer support is responsible.
  • Its performance is mind-blowing.
Jose Manuel Ortega | TrustRadius Reviewer
Score 7 out of 10
Vetted Review
Verified User
Percona Monitoring and Management (PMM) offers us a very complete view of everything that happens, allowing us to select the time intervals we want to study and individually select the database we want to see, thus improving the user experience.

"Metrics Monitor" & "Query Analitycs" are two interesting functionalities that allow us to detect problems in the performance of our queries, in addition to providing proactive information on possible performance problems in the future if what it shows us reaches the production teams with those that interact with our clients or the administrators of our company. The set of graphics and elements to select gives us great ease when configuring the dashboard to our liking and covering many of the company's needs.
  • Measure the time and performance of queries made in a database
  • Integration with tools like Prometheus with the aim of storing information based on time
  • Monitor our databases in the cloud, as well as optimize the performance of the database, improving the usability of customer applications
  • It would be interesting to add support to more monitoring tools and improve the notification system so that there are more customization options.
One of the main advantages is the integration with tools like Prometheus with the aim of storing information based on time. In addition, it offers a good interaction with the different agents using a REST API to show the results in Grafana dashboards.
  • Efficiency
  • Performance
  • Agility
Rahul Maurya | TrustRadius Reviewer
Score 9 out of 10
Vetted Review
Verified User
Incentivized
Percona Monitoring and Management has helped in monitoring thousand of database servers "MySQL" in one place which has decreased the complexity of our system. I like to do an Advanced Configuration, there is more option available to customize. I think the most valuable and secure features are the warning critical levels. For example, in one case we were looking to alert of CPU usage - and if it's over 60% in an average period of time then it's not entrusting, and if it's over 90% it's critical, which you can specify the values that are best for your application. It's easy to use and deploy with a Beautiful GUI with Grafana and has Zabbix integration.
  • Everything has its graphs by category
  • Easy enough to customized and deploy
  • Very in depth metrics for MySQL, DBaaS, ProxySQL
  • PMM alerting system should be updated and improved
  • In some categories you cant grasp 25% of information
My experience with PMM has been excellent it helps us monitoring a variety of applications such as MYSQL and MongoDB.
1. its value the ability to look at trending data history.
2. Great monitoring tools and it's free
3. Has an easy and simple solution for complex databases
5. Best for alert solution for MYSQL and MongoDB.
  • Great for MySQL Insights
  • Database internals Alerts
  • Its helps to give in depth view to Dev and DBA
  • Datadog and SolarWinds Database Performance Monitor (formerly VividCortex)
1. SolarWinds Database Performance Monitor is a good choice but has its own costly price. Percona Monitoring and Management is stacking up against it in managing hundreds of databases and storing them.
2.Datadog is also paid plus not Open source. PMM is free open source and easier to use.
Percona Monitoring and Management has its community support and provides great data in blogs and other posts. I didn't face any issues with PMM so didn't need customer support till now.
I am using PMM for a long time now and the Dashboard provides a great overview for general server health and law. You get to watch if there are many queries when you get a problem. Time-based analysis for MySQL and MongoDB servers to confirm that your data works as efficiently as possible. We could improve database performance significantly.
Miklos Szel | TrustRadius Reviewer
Score 10 out of 10
Vetted Review
Verified User
Incentivized
We monitor hundreds of database servers (MySQL) with PMM and we has been actively using it on prod since the first betas. It's extremely helpful, easy to deploy and it makes possible for the whole OPS team to check the status of the DB layer. The Query Analyzer is the only Open Source query visualization tool that is being developed and it's also useful when hunting for problematic/resource intensive queries.
  • Easy to deploy.
  • Easy to use.
  • Nice interface.
  • Setting up alerts is still complicated.
  • Automatic dashboards based on ec2 tags.
  • Better scaling for larger deployment.
There are no other open source tools out there that could compete with PMM in its league. If you use MySQL (or PostgreSQL, ProxySQL) you can have a running monitoring in a couple of minutes. The agents are not really resource intensive and Percona provides a repo for most of the main Linux distributions. The documentation is thorough and straightforward. The defaults are good!
  • We can identify issues way better.
  • We can identify blocking queries faster.
  • We can run it fully on-premises.
  • SolarWinds Database Performance Monitor (formerly VividCortex)
VividCortex is really excellent when it comes to query analysis, but it's pricy and on-premises sample collection is more problematic. When you have hundreds of machines and you even need to store the monitoring metadata locally, PMM is an excellent choice. If you are mainly interested in query analysis and on-premises hosting is not a requirement, VividCortex probably worth a look too.
Percona has a history of being good at providing really informative materials in form of blog post, documentation, webinars or conference presentations. T is also true to the Percona Monitoring and Management, you can find excellent source of information on their site or on the forum. Support tickets are also handled well.
I really like Grafana (the frontend of the PMM), but there are some minor things that sometimes don't click. For example the main dashboard lists all machines automatically, this page can be really slow when you have many instances(one can change the default landing page though). Sometimes the interface is not super responsive when making an overview for a lot of servers at once. Otherwise it's really well planned, logical and beautiful.
MySQL, SolarWinds Database Performance Monitor (formerly VividCortex), Percona Server for MySQL
Return to navigation